【监控】-Pushgateway
参考文档:https://www.cnblogs.com/xiao987334176/p/9933963.html
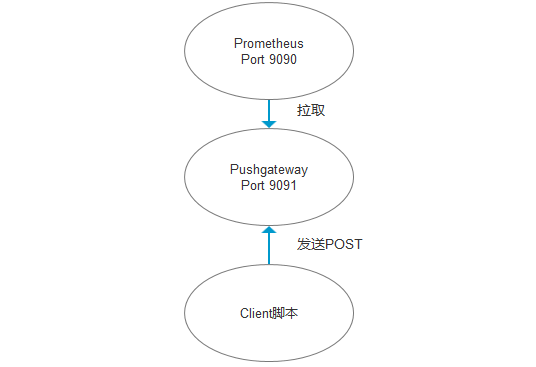
Pushgateway 是 Prometheus 生态中一个重要工具,使用它的原因主要是:
- Prometheus 采用 pull 模式,可能由于不在一个子网或者防火墙原因,导致 Prometheus 无法直接拉取各个 target 数据。
- 在监控业务数据的时候,需要将不同数据汇总, 由 Prometheus 统一收集。
由于以上原因,不得不使用 pushgateway,但在使用之前,有必要了解一下它的一些弊端:
- 将多个节点数据汇总到 pushgateway, 如果 pushgateway 挂了,受影响比多个 target 大。
- Prometheus 拉取状态 up 只针对 pushgateway, 无法做到对每个节点有效。
- Pushgateway 可以持久化推送给它的所有监控数据。
因此,即使你的监控已经下线,prometheus 还会拉取到旧的监控数据,需要手动清理pushgateway不要的数据。
本文我们主要介绍如何安装何使用Pushgateway:
一、安装阶段
1、下载,就在Prometheus的下载页面,https://prometheus.io/download/
[root@localhost ~]# wget https://github.com/prometheus/pushgateway/releases/download/v1.0.0/pushgateway-1.0.0.linux-amd64.tar.gz
2、解压和安装
#解压
[root@localhost ~]# tar -zxvf pushgateway-1.0.0.linux-amd64.tar.gz -C /apps/
#接入到解压目录
[root@localhost ~]# cd /apps/
#创建软连接
[root@localhost apps]# ln -s pushgateway-1.0.0.linux-amd64 pushgateway
3、创建数据文件目录
[root@localhost pushgateway]# mkdir /apps/pushgateway/data
4、添加到服务
#vim /usr/lib/systemd/system/pushgateway.service
#内容如下
[Unit]
Description=pushgateway
After=network.target

[Service]
Type=simple
WorkingDirectory=/apps/pushgateway
ExecStart=/apps/pushgateway/pushgateway --persistence.file=/apps/pushgateway/data/pushgateway.data
Restart=on-failure

[Install]
WantedBy=multi-user.target
5、通过服务进行启动
#加入到开机启动
systemctl enable pushgateway
#启动
systemctl start pushgateway
#停止
systemctl stop pushgateway
6、pushgateway默认端口为9091
7、配置Prometheus
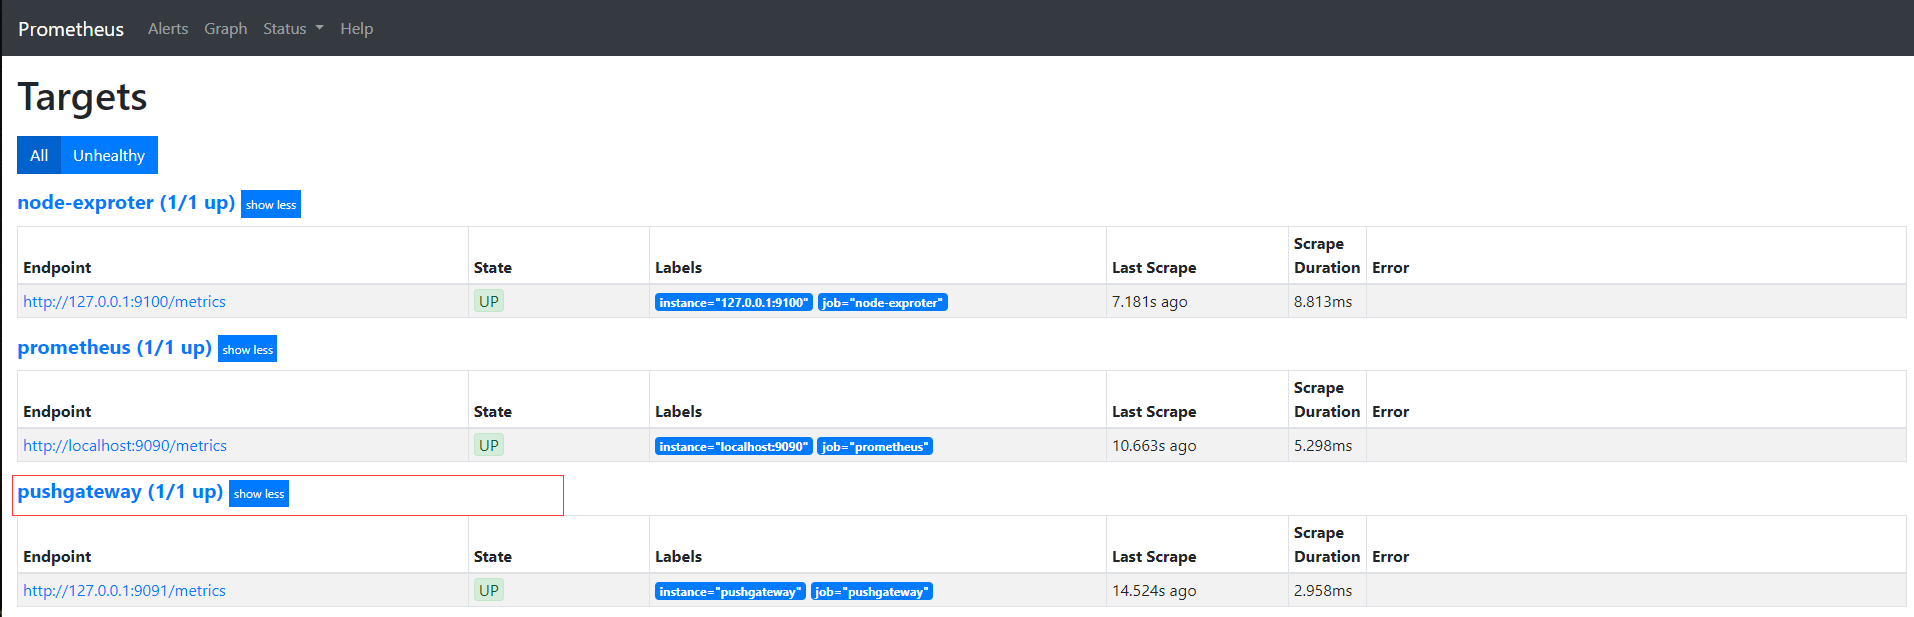
- job_name: pushgateway
    static_configs:
      - targets: ['127.0.0.1:9091']
        labels:
          instance: pushgateway

配置完后重启Prometheus,然后在Prometheus界面查看targets
以上就安装完了pushgateway,下面我们介绍如何使用呢?
二、使用pushgateway
一般我们会使用客户端SDK推送数据到pushgateway, 但是我们还可以通过API来管理, 例如:
1、将单个样本推入由{job=“some_job”}以下项标识的组中:
echo "some_metric 10" | curl --data-binary @- http://localhost:9091/metrics/job/job_one
由于未提供类型信息,因此some_metric将为type untyped。
- –data-binary 表示发送二进制数据,注意:它是使用POST方式发送。
- job_one:是我们的job名称
- some_metric:指标名称
推送成功后可以在Prometheus中查看该指标了

2、数据会带上instance, 表示来源位置
echo "some_metric 12" | curl --data-binary @- http://localhost:9091/metrics/job/job_one/instance/instance_1
3、推送更复杂数据
cat <<EOF | curl --data-binary @- http://localhost:9091/metrics/job/job_two/instance/instance_1
# TYPE some_metric counter
some_metric_2{label="val1"} 42
# TYPE another_metric gauge
# HELP another_metric Just an example.
another_metric 2398.283
EOF
注意:必须是指定的格式才行
4、删除某个组下的某实例的所有数据
curl -X DELETE http://localhost:9091/metrics/job/job_one/instance/instance_1
5、删除某个组下的所有数据
curl -X DELETE http://localhost:9091/metrics/job/job_one
更多的使用请参考:https://github.com/prometheus/pushgateway
可以发现pushgateway中的数据我们通常按照job和instance分组分类,所以这两个参数不可缺少。因为Prometheus配置pushgateway 的时候,也会指定job和instance, 但是它只表示pushgateway实例,不能真正表达收集数据的含义。所以在prometheus中配置pushgateway的时候,需要添加 honor_labels: true 参数, 从而避免收集数据本身的 job 和 instance 被覆盖。
注意,为了防止 pushgateway 重启或意外挂掉,导致数据丢失,我们可以通过 -persistence.file 和 -persistence.interval 参数将数据持久化下来。
热门标签
每日一句
-
俏也不争春,只把春来报。
——毛泽东
今日排行
- OpenCV-Python边缘检测:Sobel、Scharr、Laplacian算子和Canny算子
 图像梯度计算的是图像变化的速度。对于图像的边缘部分,其灰度值变化较大,梯度值也较大;相反,对于图像中比较平滑的部分,其灰度值变化较小,相应的梯度值也较小。图像梯度计算需要求导数,但是图像梯度一般通过计算像素值的差来得到梯度的近似值(近似导数值)。本节主要介绍Sobel算子、Scharr算子、Laplacian算子和Canny算子的使用.
 - MongoDB聚合查询之分段分组查询统计
 MongoDB聚合查询之分段分组查询统计
 - Flutter:堆组件Stack
 堆组件Stack,其实该组件主要是用于每个子组件对其和定位。默认情况下Stack组件下的子组件都在左上角。
 - Flutter常用库
本文主要记录在工作中常用的Flutter第三方库。
- Flutter中的内置Icon
Flutter中的内置Icon
点击排行
- VSCode插件 - 快速生成表格并格式化
 快速生成表格
 - Electron页面跳转、浏览器打开链接和打开新窗口
 Electron页面跳转、浏览器打开链接和打开新窗口
 - Electron打包错误“Error: Application entry file ..”解决方案
打包出现如下错误:Error: Application entry file "dist\electron\main.js" in the "D:\gui\demo2\build\win-unpacked\resources\app.asar" does not exist. Seems like a wrong configuration.
- Git保存和清除用户名、密码
 在使用Git的过程中,不想每次都输入用户名和密码去拉取代码,所以就需要保存这些信息,那么既然有保存了,就必须有清除功能。
 - mac git用户名和密码修改
 在Mac电脑中,如何对Git的用户名和密码进行修改呢?起初不懂Mac,所以整了很久,本文将记录如何对这个进行操作,以便后期使用。
 - Docker编译出现:temporary error (try again later)
 Docker编译镜像出现:fetch http://dl-cdn.alpinelinux.org/alpine/v3.12/main/x86_64/APKINDEX.tar.gz
ERROR: http://dl-cdn.alpinelinux.org/alpine/v3.12/main: temporary error (try again later)
WARNING: Ignoring APKINDEX.2c4ac24e.tar.gz: No such file or directory问题
Docker编译镜像出现:fetch http://dl-cdn.alpinelinux.org/alpine/v3.12/main/x86_64/APKINDEX.tar.gz
ERROR: http://dl-cdn.alpinelinux.org/alpine/v3.12/main: temporary error (try again later)
WARNING: Ignoring APKINDEX.2c4ac24e.tar.gz: No such file or directory问题